Tracing of Monitors & Simulators 
Motivation
This article shows how to debug the asynchronous behavior of monitoring and simulation actors. During runtime it is possible to record the eTrice messages of the miniHIL application and visualize them in a Message Sequence Chart (MSC). In this way you can verify the testing logic or track down test failures with the system under test.
Configure Tracing
First, annotate one or more ActorClasses with the @Tracing annotation. This will activate the tracing for every instance. The messages sent or received and the state changes of the state machine will be recorded.
import etrice.api.annotations.Tracing

ActorClass AMonitor {
  @Tracing
  Interface {
    Port s1: POnOff
  }
  Structure {
    external Port s1
  }
  Behavior {
    StateMachine {
      State low
      State high
      // ...
    }
  }
}
Interface {
Port s1: POnOff
}
Structure {
external Port s1
}
Behavior {
StateMachine {
State low
State high
// ...
}
}
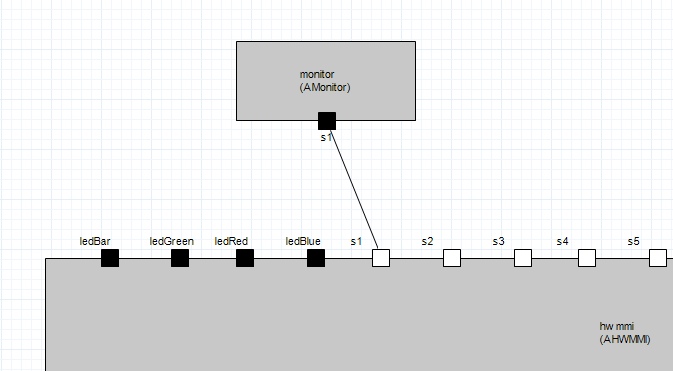
}Assuming there is an example miniHIL application. It uses the actor AMonitor from above and connects it to a simple on/off button.

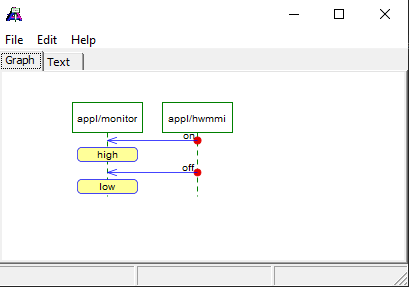
Then a single button toggle will send the messages on and off to the monitor, which will trigger a state change from high to low. This trace will produce the following diagram, called Message Sequence Chart (MSC).
Further you can extend the trace with custom textual comments. Use on of the following C macros in the action codes of the annotated ActorClass.
ET_MSC_TRACER_ACTOR_NOTE("Button press detected")
ET_MSC_TRACER_GLOBAL_EVENT("Button press and release detected")
ET_MSC_TRACER_HIDDEN_TEXT("Not displayed in diagram, but written into text source file")
The textual comments are rendered like this:
Controlling Tracing
In order to create the MSC of a running miniHIL application, the recording of the traces has to be started and then finally sent to the pc. This can be done either manually using the UI or by event in the miniHIL application.
Manually in UI

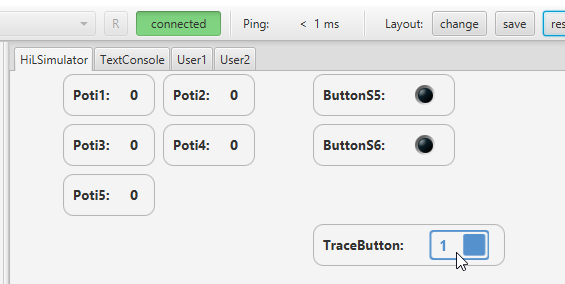
Activating the TraceButton will start recording messages of the instrumented actors. Deactivating will stop the recording and sent the traces to the PC and create the MSC. The diagram can be found in HilSimGUI/etTraces/, see Open Trace Diagrams.
Event triggered
The protocol for controlling the tracing at runtime is PTracer. It allows to activate the tracing for a given event, e.g. specific time point in the test or manually using a hardware button. The following example shows the actor ATraceButton, whose purpose is to control the tracing via the POnOff protocol.
import minihil.api.onoff.POnOff
import etrice.api.tracer.PTracer

/**
 * Button to activate MSC tracing while button is held.
 */
ActorClass ATraceButton {
	Interface {
		Port button: POnOff
	}
	Structure {
		SAP tracer: PTracer
		external Port button
	}
	Behavior {
		StateMachine {
			State idle
			State active {
				entry '''
					// start tracing messages
					tracer.start();
				'''
				exit '''
					// stop tracing messages
					tracer.stop();
					// send traces to PC and create diagram
					tracer.flush();
				'''
			}
			Transition init0: initial -> idle
			Transition tr0: idle -> active {
				triggers {
					<on: button>
				}
			}
			Transition tr1: active -> idle {
				triggers {
					<off: button>
				}
			}
		}
	}
}
 |
Declare a SAP of protocol PTracer |
 |
use start() to start recording messages of all instrumented actors |
 |
use stop() to suspend tracing, no message will be recorded |
 |
call flush() send the trace to PC create a new diagram containing all recorded messages |
Open Trace Diagrams
The diagrams are written to the following folder
-
HilSimGUI/etTraces/ when using the GUI
-
MinihilProject/build/etTraces/ when executing the tests from CLI
Every call to flush() will create a new diagram, which are numbered consecutively.
The diagrams have the file extension .seq and are opened with the tool Trace2UML, which can be found in the miniHIL tools under the same name.

Summary
The MSC tracing can be used to visualize the message interchange of eTrice actors like monitoring and simulation elements that participate in advanced test setups.
See Also
-
ProtocolClass PTracer
-
ActorClass ATraceButton
-
Tool Hil Simulator GUI